FCE GIS Data and Maps
GIS Data
EVERSpatDat R package A collection of Everglades spatial data used for creating FCE maps in R created by Dr. Paul Julian-
Outside Agency GIS Data
-
FLORIDA BOUNDARIES
- Florida Boundary Lines
Source: Southwest Florida Water Management District (SWFWMD) - Florida Boundary - Polygon
Source: St. Johns River Water Management District (SJRWMD) - Florida Counties
Source: Southwest Florida Water Management District (SWFWMD) - FDOT GIS Functional Classification Roadways
Source: Florida Department of Transportation (FDOT) - National Park Service unit boundaries
Includes the boundary of Everglades National Park
Source: National Park Service - Land Resources Division - Arc Hydro Enhanced Database (AHED) Watersheds
Includes the boundaries of Water Conservation Areas (WCAs)
Source: South Florida Water Management District - Arc Hydro Enhanced Database (AHED) Canals and Streams
Source: South Florida Water Management District - SFWMD Land Cover Land Use 2014-2016
Source: South Florida Water Management District - SFWMD Land Cover Land Use 2008-2009
Source: South Florida Water Management District - SFWMD Land Cover Land Use 2004-2005
Source: South Florida Water Management District - SFWMD Land Cover Land Use 1999
Source: South Florida Water Management District - SFWMD Land Use 1995
Source: South Florida Water Management District - Global Mangrove Loss Drivers
Website and Earth Engine app which shows global mangrove loss from 2000-2016. Liza Goldberg created the website for the Goldberg et al. 2020 paper in Global Change Biology.
Source: NASA, University of Maryland, and East Carolina University - The Everglades National Park and Big Cypress National Preserve Vegetation Mapping Project: Geodatabase–Southeast Saline Everglades (Region 2), Everglades National Park (2017)
Source: National Park Service - Vegetation Map and Digital Database of South Florida's National Park Service Lands (1995)
Source: Center for Remote Sensing and Mapping Science, Department of Geography at The University of Georgia, South Florida Natural Resources Center at Everglades National Park
- NASA G-LiHT: Goddard's LiDAR, Hyperspectral & Thermal Imager
- USGS EarthExplorer
Landsat, Aerial Imagery, Sentinel-2, and other remote sensing data - Land Boundary Information System (LABINS)
Aerial images - ESA's Copernicus Open Access Hub
Sentinel data products
- Florida Boundary Lines
FCE Maps
Complete accuracy of maps cannot be guaranteed. All maps are made available "as is". The Florida Coastal Everglades LTER shall not be liable for damages resulting from any use or misinterpretation of maps.-
Maps of FCE LTER Sites
EVERSpatDat R package A collection of Everglades spatial data used for creating FCE maps in R created by Dr. Paul Julian FCE site map with a grayscale base layer
The GitHub repository for the FCE site map includes the R script and the shapefiles used to create the map. The map can be customized in R. The repository also includes an enhanced map created in Affinity Designer as well as exported versions of each map.Credit for maps: Mike Rugge, Florida Coastal Everglades LTER, CC BY 4.0
FCE site map with a grayscale base layer created in R and enhanced in Affinity Designer. View a PDF of this map.
-
Maps of Height and Biomass of Mangrove Forests in Everglades National Park
The maps of mean mangrove height and biomass in Everglades National Park (ENP) were produced using the elevation data from the Shuttle Radar Topography Mission (SRTM). They represent the status of the mangrove forest in February of 2000.
The SRTM data was calibrated using airborne LIDAR data and a high resolution USGS Digital Elevation Model (DEM). The mangrove height map has a mean tree height error of 2.0m (RMSE) over a single pixel of 30m. In addition, we used field data to derive a relationship between mean forest stand height and biomass in order to map the spatial distribution of standing biomass of mangroves for the entire National Park.
The maps were produced as part of an Interdisciplinary Science project led by Marc Simard at the Jet Propulsion Laboratory, California Institute of Technology, under a contract with the National Aeronautics and Space Administration (NASA).Reprinted with permission from The American Society for Photogrammetry & Remote Sensing.
Simard, Marc; Keqi Zhang, Victor H. Rivera-Monroy, Michael S. Ross, Pablo S. Ruiz, Edward Castaneda-Moya, Robert R. Twilley, and Ernesto Rodriguez, 2006. "Mapping Height and Biomass of Mangrove Forests in Everglades National Park with SRTM Elevation Data" Photogrammetric Engineering & Remote Sensing. Vol.72, No.3, pp. 299-311.
-
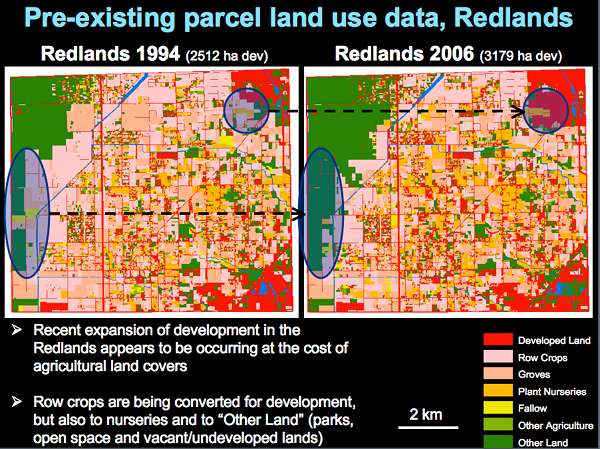
Maps of Land Cover Change in Southern Miami-Dade County
Southern Miami-Dade County serves as a critical buffer zone located between two national parks. In this project, we examine the process of rapid suburbanization as agricultural lands transition to residential development. Strategies to slow suburbanization at local and regional scales include growth management policies and zoning regulations. In particular, zoning ordinances serve the primary method for lessening and preventing the conversion of agricultural and forested lands-though zoning has also been implicated in increased landscape fragmentation. To understand the effectiveness of zoning in protecting rural lands, FCE researchers are using recently acquired high-resolution GeoEye imagery to quantify green vegetation, classify prevailing land use/covers (including lawns) and derive indices of landscape structure for the study site. These recent data capture present-day land cover (April 2009), and will be additionally linked to historical data for previous years (2004 CIR digital orthophotographs, 3-band digital orthophotographs, historical aerial photography). For broader area coverage we will investigate cross-platform data merging, dasymmetric mapping and change detection using Landsat TM imagery. To facilitate cross-LTER site comparisons, moreover, FCE researchers are collaborating with other LTER sites (BES, PIE and CAP) to employ common approaches to cover characterization. These initiatives employ object-oriented methodologies (within a Definiens software environment) linked with ancillary GIS data for image segmentation, rule development and classification in an iterative approach.
The study area (with current and 2004 data coverage grid), a target land cover classification scheme and preliminary classification are exemplified in the maps above.
-
Political Ecology of Land Use Change
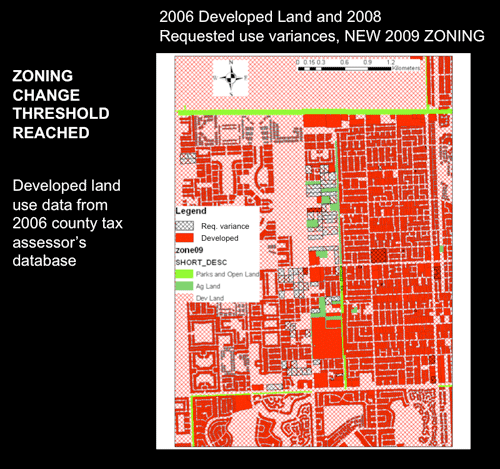
Southern Miami-Dade County serves as a critical buffer zone located between two national parks. In this project, we examine the process of rapid suburbanization as agricultural lands transition to residential development. Strategies to slow suburbanization at local and regional scales include growth management policies and zoning regulations. In particular, zoning ordinances serve the primary method for lessening and preventing the conversion of agricultural and forested lands-though zoning has also been implicated in increased landscape fragmentation. To understand the role of zoning in shaping (or not) the conversion of agricultural lands into residential lands in southern Miami-Dade County, FCE researchers have been analyzing parcel-scale zoning data (supplied by Miami-Dade County, Dept. of Planning and Zoning) using GIS.

Download a zip file (1.77MB) containing all of the images of 2002-2008 Developed Land.

Please click on the image to view a larger version of the image.
-
DOQ Maps of FCE LTER Sites

USGS 3.75 Minute Color Infrared (CIR) DOQ Quads
DOQ Flight Dates:
December 27, 1994- TS/Ph 1-3,6-8, & 10; SRS 2,3
January 15, 1994- TS/Ph 9
January 10, 1995- SRS 4
January 24, 1995- SRS 5,6
January 14, 1996- SRS 1
Map Projection: Albers
Map Datum: NAD 83
Maps Created by Linda Powell, FCE LTER Project


